“Sell in May and go away” is an old English phrase that is repeated as a warning against the ravages of seasonality in the market, though it was a different market than the one under study here.
I’m not going to entertain narratives about why there might be a seasonal effect in market returns, because frankly I think such narratives are fragile things that should not be traded on unless they are rigorously supported by data.
Instead, let’s just test it.
Base Rates
First, let’s do the basic statistics for reference. Here I’ve computed the average monthly returns in the S&P 500 index from 1950-01-03 to 2021-08-27:
Month      Average Return
January    +1.1%
February    0.0%
March      +1.0%
April      +1.7%
May        +0.2%
June       +0.1%
July       +1.2%
August     +0.1%
September  -0.5%
October    +0.8%
November   +1.7%
December   +1.5%
All Months +0.7%
We aren’t seeing very huge swings here. It looks like September is the worst month to hold the S&P 500 and April and November are the best, but is this just random happenstance? Let’s dig into that question next.
Bayesian Checks
Here’s the basic causal premise we’re evaluating here:
This particular calendar month causes returns to be different than the returns for other calendar months.
To evaluate this, I’m going to pool all of the selected month returns and estimate their combined distribution. Against that distribution I will compare the distribution of all the other months.
We’ll try to see if these two distributions seem different. If not, then this seasonality thing is probably bunk for this index over the time period selected.
January
Looks like January might skew a bit lower, with an average return that is expected to be 0.9% lower than all other months. Not a lot of certainty around that number.
February
February isn’t much different from other months, though perhaps a tad higher. This doesn’t look very significant to me.
March
March is pretty similar to February, except a tad more positive. On average March is expected to be +0.9% higher than all other months. The credible interval here is very wide.
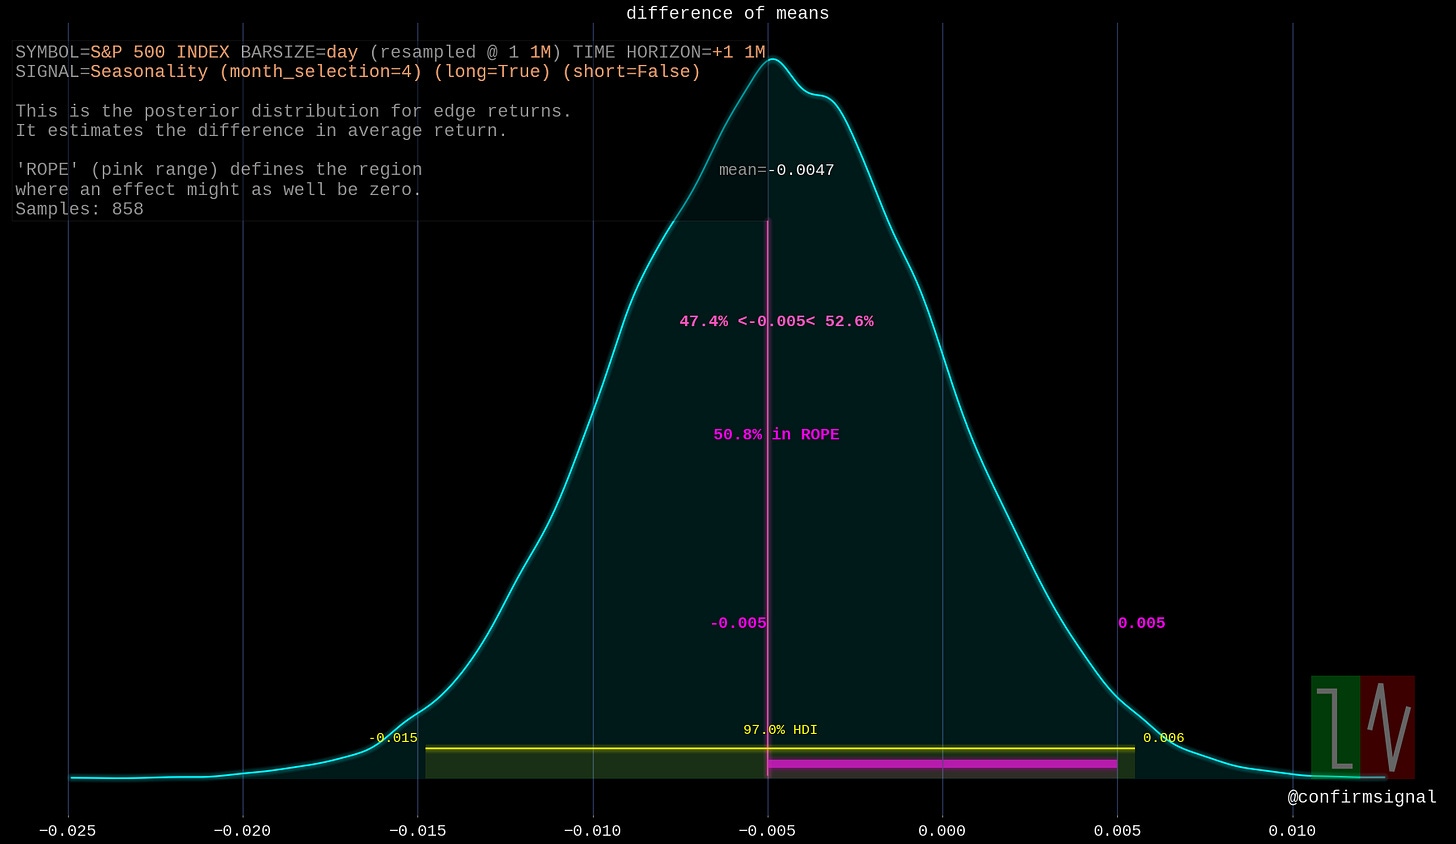
April
April seems to be the opposite of February: lower returns expected versus other months, but not strongly so. Very wide credible interval indicates a low confidence in the effect.
May
May is quite similar to January. On average May returns are expected to be 0.7% lower than the returns for all other months - but the credible interval ranges from -1.7% to 0.2%.
June
June returns appears to be expected to be the same as all other months, though the credible interval skews towards higher.
July
July returns are expected to be on average a tad lower than all other months, though against we’re seeing a wide credible interval here which implies a lack of certainty.
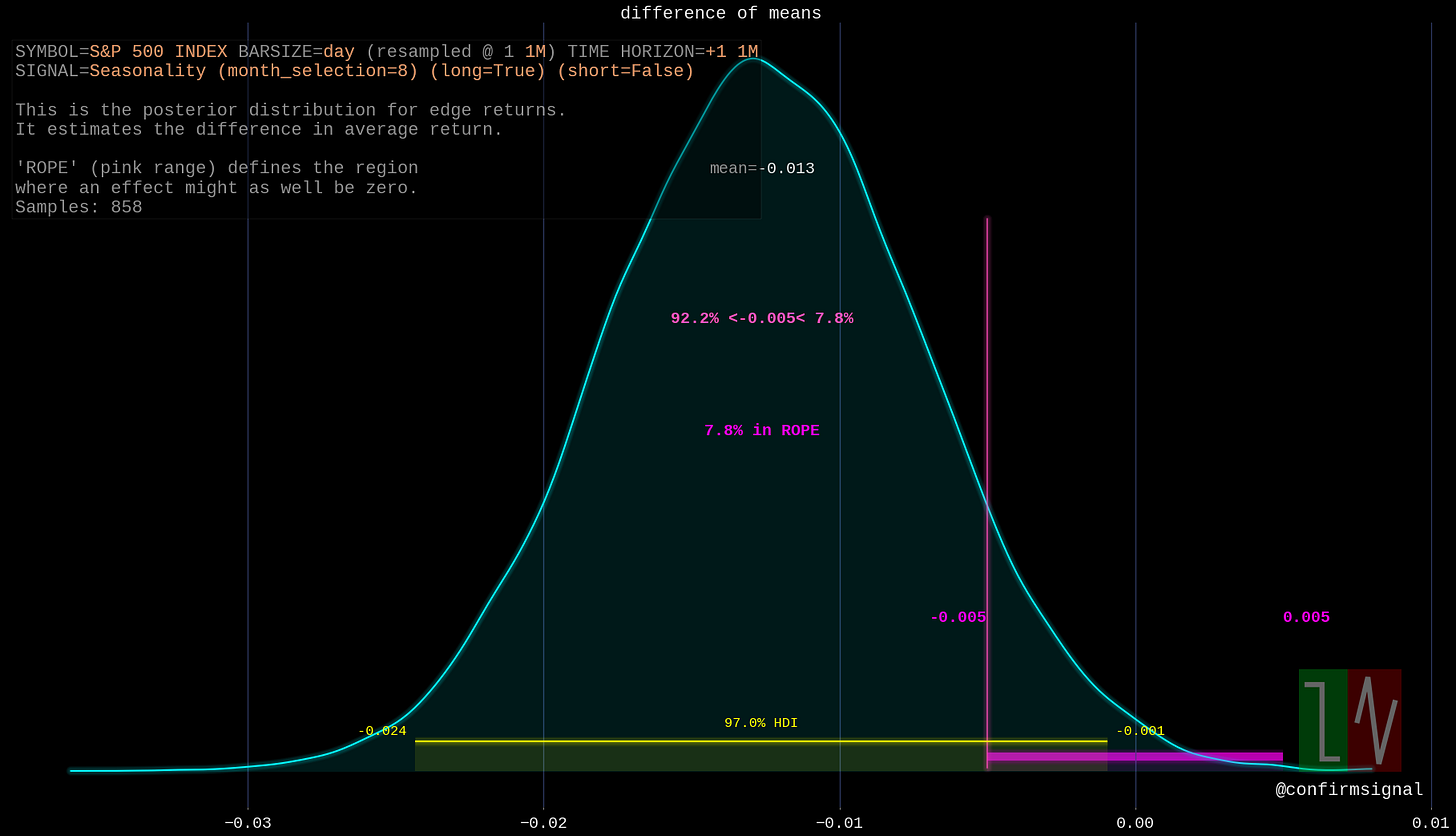
August
Hey, this is a bit more interesting! August returns are expected to be on average 1.3% lower than the returns for all other months, and the credible interval doesn’t even include zero!
Keep in mind that “lower than other months” does not necessarily mean negative.
September
Nothing special about September.
October
October is on average 1% higher than all other months, and the credible interval does not include zero! The “edge” of October averages around +1%.
November
This is starting to get pretty boring, but we’re nearly done! November skews greater than all other months, with an average “edge” of +0.7%. Nothing I’d base a trade off of, though.
December
Nothing special about December.
Comparison - Base Rates
Let’s review our results against those base statistics we calculated earlier:
Month      Average    Bayesian Mean “Edge”1
January    +1.1%      -0.9%
February    0.0%      +0.4%
March      +1.0%      +0.9%
April      +1.7%      -0.5%
May        +0.2%      -0.7%
June       +0.1%      +0.4%
July       +1.2%      -0.1%
August     +0.1%      -1.3%
September  -0.5%      +0.1%
October    +0.8%      +0.1%
November   +1.7%      +0.7%
December   +1.5%      +0.2%
All Months +0.7%       N/A
The average returns are not similar to the Bayesian posterior edges we found, but they aren’t the same kinds of numbers. To evaluate something similar, we should look at the posterior distribution of a particular month’s returns alone. We can look at the average for that posterior versus the average above, which is a direct comparison.
The Bayesian posterior for a month’s returns is a credible guess about what will occur and the simple average is what did occur. I’ll pick the month with what looks like the largest effect: August. Let it be the champion of S&P 500 seasonality.
Comparison - Largest Effect
This picture shows the expected range for August returns. As you can see, the most likely value is -0.3% (not too far from the actual average of +0.1%). The credible interval spans between -11% to +10.4%. If you went short based on the prior edge finding, you’d probably be surprised. This doesn’t credibly look different from a zero-centered distribution.
Here’s the expected range for all other months except August. The average for this is about 1%, which explains the edge value of -1.3% we found earlier. Still, we have a massive credible range here, and it’s center could well be correctly placed at zero too.
It looks like you’d have to add a great deal of data to narrow in on the true mean - and that mean would probably not help you trade since it only becomes obvious after many trials. I don’t want my edge to be clear only after thousands of trades - I still pay commission.
Let’s put these numbers into a broader context: the simple mean return across all months is +0.7% and the mean absolute difference of returns around this average is +3.2%. These “edges” of ±1.7% are rookie numbers, much smaller than normal variation.
In conclusion, there is some statistical significant differences between some months and the others. However, these effects are so damn small and uncertain you’d be pretty foolish to trade based on them.
Statistical significance is not the same as tradable signal; and the significance is very arguable here.
I frequently call the difference of means posterior “edge”, though that can potentially be misleading especially when used as a single number. See the final comparison for an illustration why.


